The genus trace: a function that shows values of genus (vertical axis) for subchains spanned between the first residue, and all other residues (shown on horizontal axis). The number of the latter residue and the genus of a given subchain are shown interactively.
Total Genus |
15
|
sequence length |
40
|
structure length |
40
|
Chain Sequence |
FPRWKRHISEQLRRRDRLQRQAFEEIILQYNKLLEKSDLH
|
The genus matrix. At position (x,y) a genus value for a subchain spanned between x’th and y’th residue is shown. Values of the genus are represented by color, according to the scale given on the right.
After clicking on a point (x,y) in the genus matrix above, a subchain from x to y is shown in color.
| publication title |
Insights into autophagosome maturation revealed by the structures of ATG5 with its interacting partners
pubmed doi rcsb |
| molecule tags |
Protein binding
|
| source organism |
Homo sapiens
|
| molecule keywords |
Autophagy protein 5
|
| total genus |
15
|
| structure length |
40
|
| sequence length |
40
|
| chains with identical sequence |
D, F
|
| ec nomenclature | |
| pdb deposition date | 2014-06-10 |
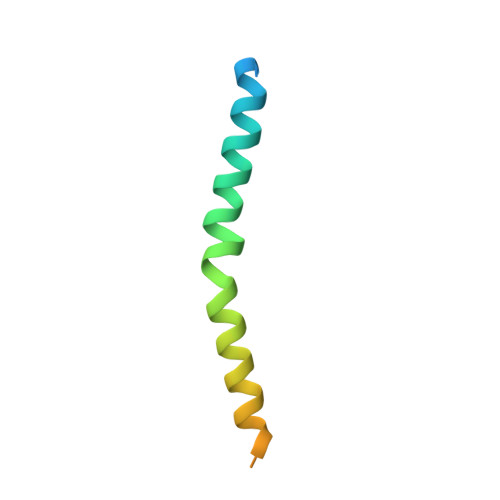
 Image from the rcsb pdb (www.rcsb.org)
#similar chains in the Genus database (?% sequence similarity)
...loading similar chains, please wait...
#similar chains, but unknotted
...loading similar chains, please wait...
#similar chains in the pdb database (?% sequence similarity)
...loading similar chains, please wait...